How to Make a Graph in Google Sheets With Multiple Lines
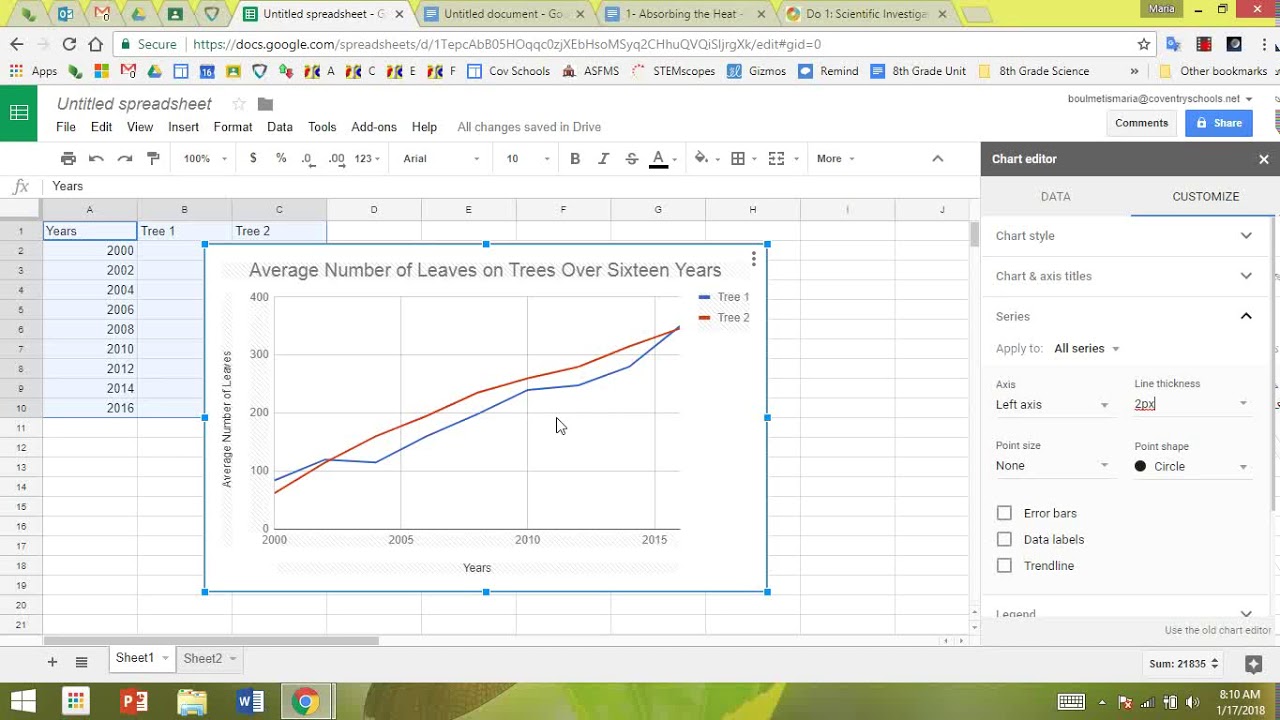
To make a graph in Google Sheets with multiple lines, select your data, click “Insert” and choose the line chart option. In Google Sheets, creating a graph with multiple lines is a straightforward process that can help visualize data trends and comparisons effectively. You can input your data, select the ranges you want to graph, … Read more


