To know if data is normally distributed in Excel, create a histogram and check for a bell-shaped curve. Determining if your data follows a normal distribution is essential in many statistical analyses.
Excel provides tools to visually assess the distribution of your data and determine if it fits a normal curve. By constructing a histogram and observing a bell-shaped curve, you can gain insights into the distribution of your data. This simple yet effective method helps you ascertain whether your data is normally distributed, enabling you to make informed decisions in your data analysis processes.
Knowing the distribution of your data is crucial for accurate and reliable statistical analysis and decision-making.
Credit: www.automateexcel.com
Visual Assessment
In order to determine if data is normally distributed in Excel, a visual assessment is crucial. This involves using graphical tools to analyze the distribution of the data. Two common methods of visually assessing normal distribution are through the use of histograms and QQ plots.
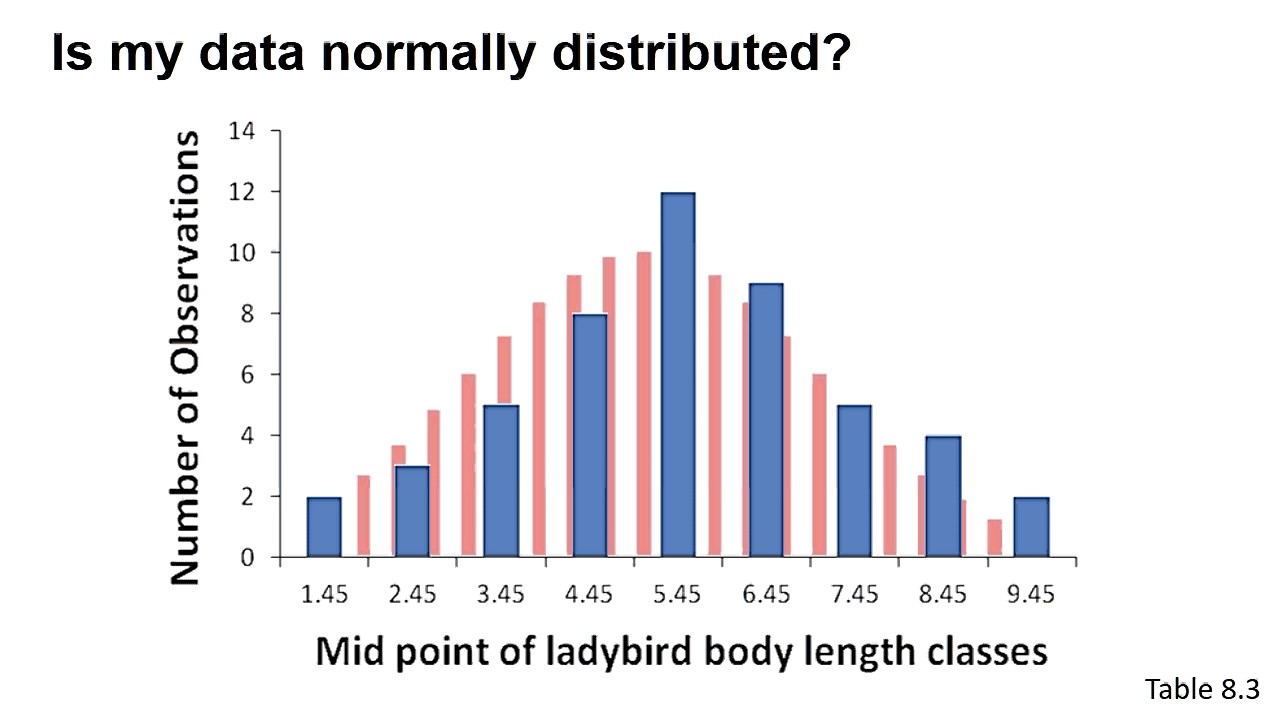
Histogram
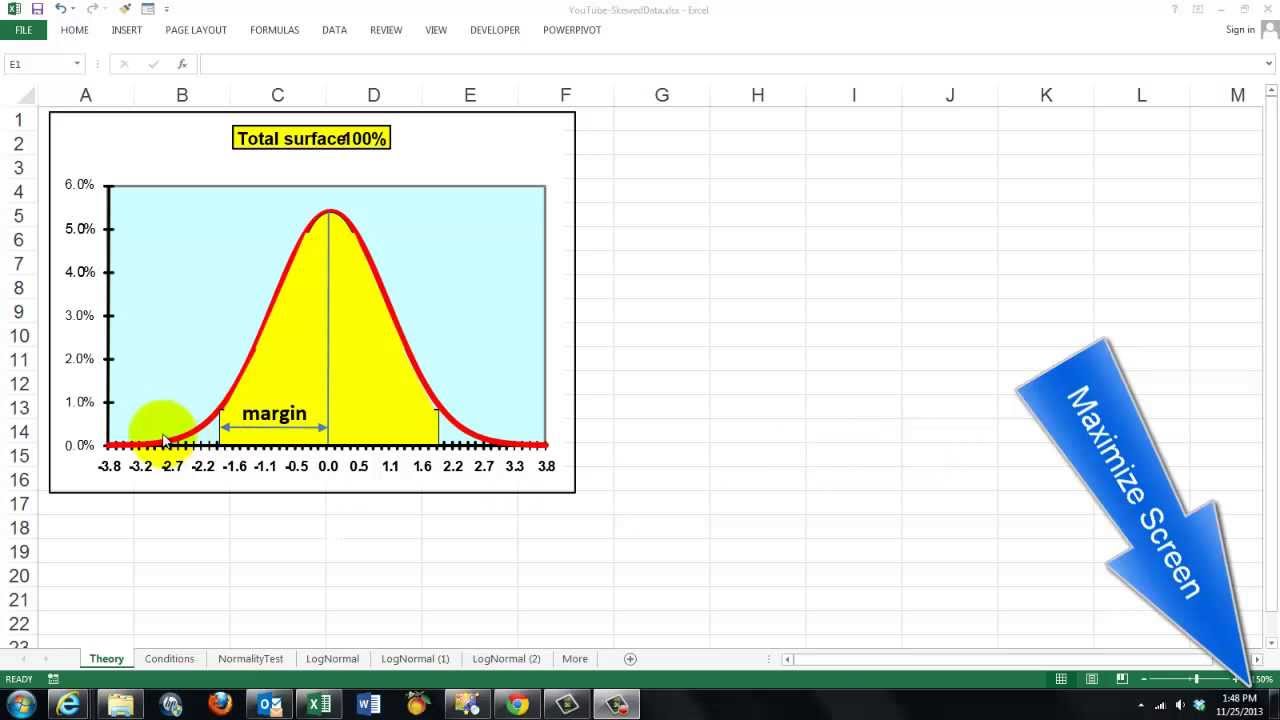
A histogram is a visual representation of the distribution of data. In Excel, a histogram can be created by using the Data Analysis Toolpak. It allows for the visualization of the shape of the data distribution, providing insights into whether the data is normally distributed or not. The symmetrical bell-shaped curve on the histogram indicates normal distribution.
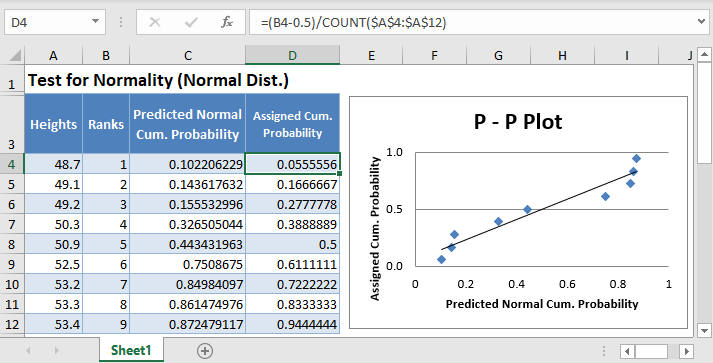
Qq Plot
QQ plot, short for quantile-quantile plot, is another visual method for assessing normality of data. In Excel, the QQ plot can be created by plotting the quantiles of the data against the quantiles of a normal distribution. If the data points fall along a straight line, it indicates that the data is normally distributed.

Credit: www.inprolink.com
Statistical Tests
Statistical tests are crucial in determining if data is normally distributed in Excel. Two common tests for this purpose include the Shapiro-Wilk Test and the Kolmogorov-Smirnov Test.
Shapiro-wilk Test
The Shapiro-Wilk Test is used to assess whether a dataset comes from a normally distributed population.
Kolmogorov-smirnov Test
The Kolmogorov-Smirnov Test is used to compare a sample distribution with a theoretical distribution.
Interpreting Results
Understanding how to interpret the results when assessing data for normal distribution is crucial in data analysis. In Excel, two key factors to consider are the p-value and critical values.
P-value
The p-value indicates the statistical significance of the data distribution.
Critical Values
Critical values help determine if the data deviates significantly from a normal distribution.
Credit: m.youtube.com
Frequently Asked Questions For How To Know If Data Is Normally Distributed In Excel
How Do You Tell If A Data Set Is Normally Distributed In Excel?
To determine if a data set is normally distributed in Excel, use histogram and q-q plot functions. Observe a bell-shaped curve within the histogram and a straight line in the q-q plot to indicate normal distribution. Remember to analyze data to verify normality.
How Do You Determine If Data Is Normally Distributed?
To determine if data is normally distributed, analyze the histogram and check for a bell-shaped curve. Additionally, you can use statistical tests like the Shapiro-Wilk or Kolmogorov-Smirnov test.
How Do You Display The Normal Distribution In Excel?
To display the normal distribution in Excel, you can use the NORM. DIST function. This function calculates the probability of a value occurring within a given range in a normal distribution. Simply enter the necessary parameters, such as the value, mean, and standard deviation, to generate the distribution.
How Do You Know If A Variable Is Normally Distributed?
You can determine if a variable is normally distributed by using statistical tests or visual methods. Statistical tests such as the Shapiro-Wilk test can assess normality. Visual methods like histograms and Q-Q plots can also provide insight.
Conclusion
Detecting normal distribution in Excel involves understanding key statistical concepts. By visualizing data and utilizing statistical tests, you can confidently assess normality. Excel’s tools offer valuable insights and empower informed decision-making. Embracing these methods equips you to effectively analyze and interpret data with confidence.
Understanding normal distribution is a pivotal aspect of statistical analysis.