Linear Regression in Google Sheets is a statistical method used to analyze relationships between variables. It calculates a straight line that best fits the data points.
Linear Regression in Google Sheets is a valuable tool for predicting future trends based on historical data. By utilizing this feature, you can make informed decisions and improve forecasting accuracy. With its user-friendly interface, Google Sheets offers a simple way to perform linear regression analysis without the need for complex software or coding skills.
In this guide, we will explore how to use Linear Regression in Google Sheets to analyze your data and gain valuable insights for your business or personal projects.
Credit: www.youtube.com
Introduction To Linear Regression
Linear regression is a powerful statistical method used to model the relationship between a dependent variable and one or more independent variables. It is a fundamental technique in the field of statistical analysis and has numerous practical applications in various industries.
What Is Linear Regression?
Linear regression is a statistical approach for modeling the relationship between a dependent variable and one or more independent variables. It aims to find the best-fitting straight line that describes the relationship between the variables. The relationship is represented by the equation Y = aX + b, where Y is the dependent variable, X is the independent variable, a is the slope of the line, and b is the intercept. This method is widely used for predicting future values, understanding the strength of relationships, and identifying patterns in data.
Applications Of Linear Regression
Linear regression is extensively used in various fields such as finance, economics, marketing, and science. Some of its key applications include:
- Predictive Analysis: Forecasting sales, stock prices, and other future trends.
- Medical Research: Analyzing the relationship between variables in clinical studies.
- Marketing: Determining the impact of advertising on sales and customer behavior.
- Quality Control: Evaluating the factors affecting product quality and performance.
Getting Started With Google Sheets
Linear Regression in Google Sheets is an essential tool for data analysis. Let’s dive into how to get started with Google Sheets and explore its features.
Creating A New Spreadsheet
- Click on the “+ New” button in Google Sheets to create a new spreadsheet
- Give your spreadsheet a title by clicking on “Untitled Spreadsheet” at the top
- Start entering your data in the cells to begin your analysis
- Utilize the functions and formulas in Google Sheets to manipulate your data
Importing Data Into Google Sheets
- Click on the “File” tab and select “Import” to import data into Google Sheets
- Choose the source of your data, whether it’s from a file on your computer or from Google Drive
- Select the data you want to import and adjust the settings as needed
- Click on “Import data” to bring the data into your spreadsheet for analysis
Performing Linear Regression In Google Sheets
Discover how to effectively perform linear regression in Google Sheets, a powerful tool that allows you to analyze and visualize relationships between variables. Gain valuable insights from your data with this user-friendly and efficient feature.
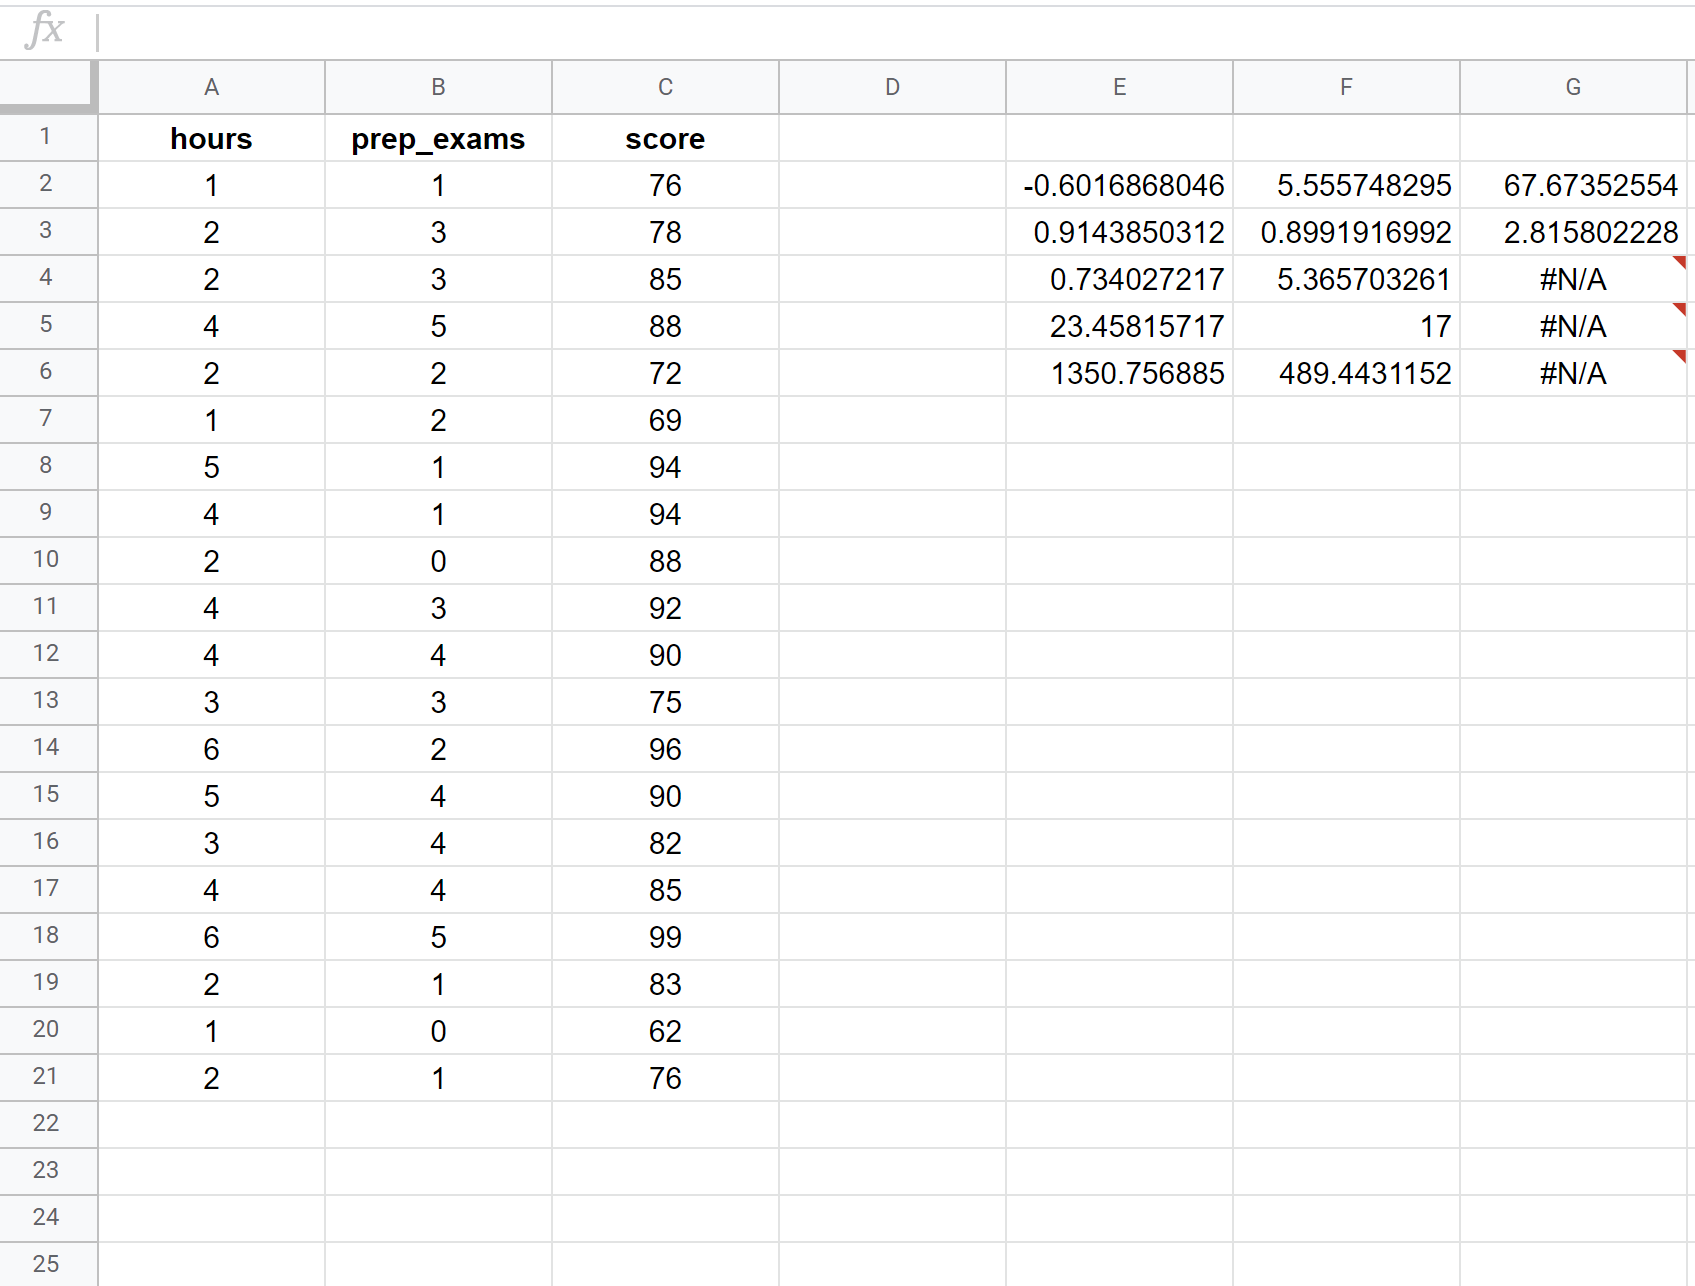
Performing Linear Regression in Google Sheets Linear regression in Google Sheets is a powerful tool for analyzing and interpreting data. By utilizing the LINEST function, you can easily perform linear regression analysis to uncover relationships between variables in your dataset. Setting Up the Data – Arrange your data in two columns: one for the independent variable and one for the dependent variable. – Ensure that your data is well-organized and free of any empty cells or errors that could impact the accuracy of your regression analysis. Using the LINEST Function – Utilize the LINEST function to calculate the coefficients of the regression equation, including the slope, y-intercept, and R-squared value. – Input your data range into the function and let Google Sheets do the heavy lifting of calculating the regression parameters for you. Interpreting the Results – Examine the slope of the regression line to understand the relationship between the independent and dependent variables. – Analyze the R-squared value to determine the goodness of fit of the regression model to your data. – Interpret the y-intercept as the predicted value of the dependent variable when the independent variable is zero. In conclusion, Linear regression in Google Sheets provides a straightforward way to perform data analysis and gain insights into the relationships between variables in your dataset. By following these steps, you can effectively utilize linear regression to enhance your decision-making process and drive informed actions based on data-driven insights.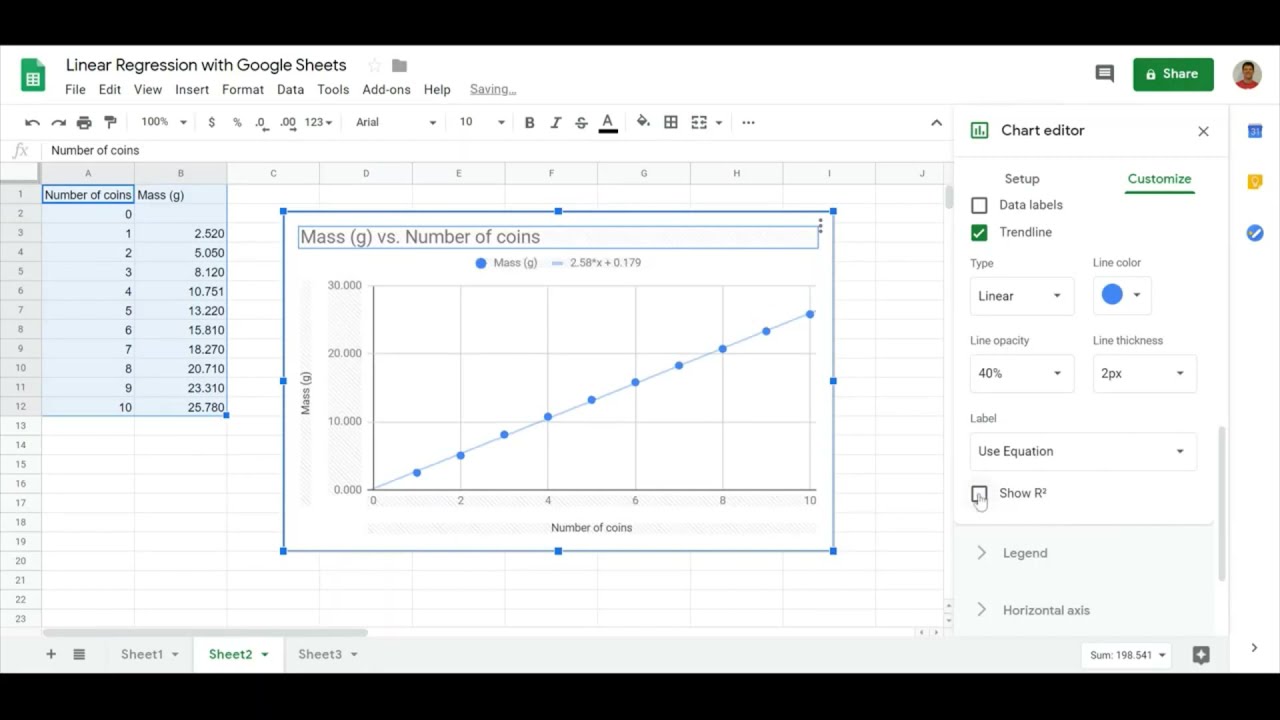
Credit: m.youtube.com
Advanced Techniques
When it comes to advanced techniques in linear regression using Google Sheets, multiple linear regression and polynomial regression are powerful tools that allow for more complex analysis and prediction capabilities.
Multiple Linear Regression
Multiple linear regression is an extension of simple linear regression and involves predicting a continuous dependent variable using two or more independent variables. It’s a valuable technique for modeling the relationship between multiple predictors and the target variable.
Polynomial Regression
Polynomial regression is a type of regression analysis where the relationship between the independent variable and dependent variable is modeled as an nth degree polynomial. This technique allows for the fitting of a curved line to the data points, enabling more flexible and non-linear modeling.
Data Visualization And Analysis
Data Visualization and Analysis are crucial steps in understanding and interpreting data. By visualizing data, patterns and relationships can be identified more easily, and insights can be drawn to make informed decisions. Google Sheets offers a powerful tool for data visualization and analysis through Linear Regression, allowing users to create scatter plots and evaluate regression models.
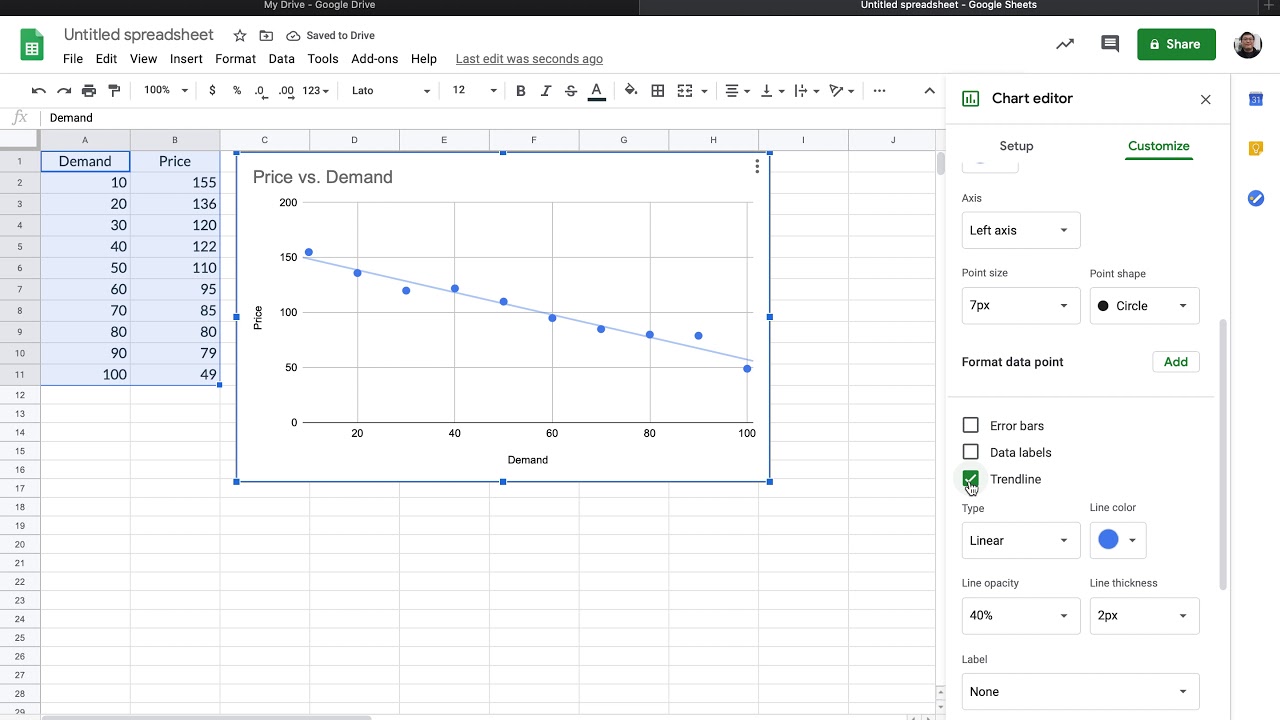
Creating Scatter Plots
A scatter plot is a graphical representation of data points on a Cartesian plane, with one variable plotted on the x-axis and another variable plotted on the y-axis. It helps in identifying patterns, trends, and correlations between the variables.
Creating a scatter plot using Linear Regression in Google Sheets is simple and intuitive. Follow the steps below:
- Open a new or existing Google Sheets document.
- Select the data range for the x-axis variable and y-axis variable.
- Click on the “Insert” tab in the top menu and select “Chart”.
- In the sidebar that appears, choose “Chart type” as “Scatter chart”.
- Customize the chart by adding titles, labels, and adjusting the axis scale as needed.
- Click on the “Insert” button to add the scatter plot to your Google Sheets document.
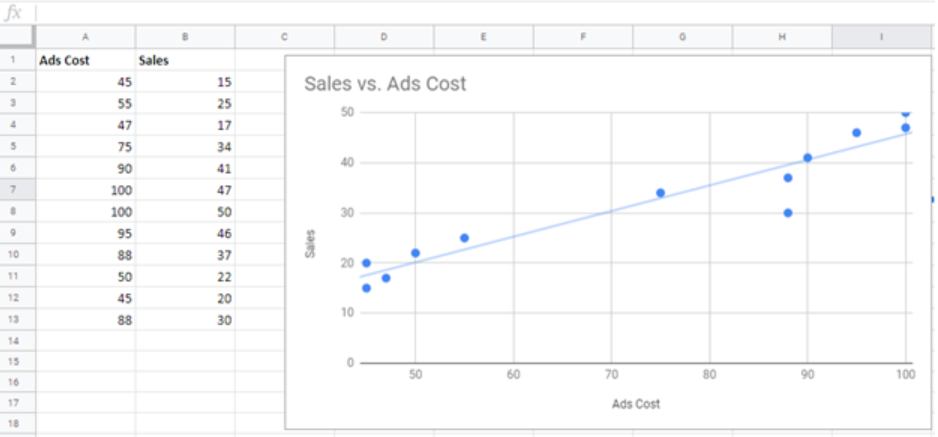
By creating scatter plots in Google Sheets, you can visually explore the relationship between variables and identify any possible trends or outliers.
Evaluating Regression Models
Evaluating regression models is essential to determine the accuracy and reliability of predictions generated by these models.
In Google Sheets, you can evaluate regression models using the following techniques:
- Regression Statistics: Google Sheets provides regression statistics such as R-squared, which indicates the proportion of the dependent variable’s variability that can be explained by the independent variable.
- Residual Analysis: Residuals are the differences between the actual values and the predicted values by the regression model. By analyzing the residuals, you can assess if the model’s assumptions are met and if there are any systematic errors.
- Visualization: Visualizing the regression line along with the scatter plot can help in evaluating the fit of the model. If the line closely aligns with the data points, it suggests a good fit, whereas deviations indicate potential issues.
Through these evaluation techniques, you can assess the performance and reliability of the regression models created in Google Sheets. This empowers you to make data-driven decisions using accurate and trustworthy predictions.
Credit: www.got-it.ai
Frequently Asked Questions Of Linear Regression Google Sheets
How Do I Do A Linear Regression In Google Sheets?
To do a linear regression in Google Sheets, use the “LINEST” function to calculate the slope and y-intercept. Enter your data in columns, then use the function to analyze the relationship between variables.
Can Google Sheets Do Multiple Regression?
Yes, Google Sheets can perform multiple regression analysis using the built-in functions and tools.
Can Google Sheets Do Logistic Regression?
No, Google Sheets cannot perform logistic regression natively. It’s not a feature available in the tool.
How Do You Find The Linear R Squared Value In Google Sheets?
To find the linear R squared value in Google Sheets, use the function =RSQ() by entering the known y and x data. Then press enter, and the linear R squared value will be displayed.
Conclusion
Linear regression in Google Sheets offers a powerful tool for data analysis and prediction. By easily visualizing relationships between variables, users can make informed decisions based on their data. With the step-by-step process outlined in this blog, you can confidently apply linear regression to your own projects and unlock valuable insights.
Start leveraging the full potential of linear regression in Google Sheets today!