To make an assignment spreadsheet, use Google Sheets or Excel, create columns for different categories, like task, deadline, and status. Organize data systematically for easy tracking and updates.
Assignments can be overwhelming, especially when managing multiple tasks. Creating an assignment spreadsheet can help streamline your workload and stay on top of deadlines. By following a few simple steps, you can easily set up a spreadsheet that includes all necessary information such as task descriptions, due dates, and progress status.
This tool will not only help you manage your assignments effectively but also provide a centralized platform for keeping track of your tasks efficiently. We will guide you through the process of creating an assignment spreadsheet that fits your needs and helps you stay organized and productive.
Setting Up The Spreadsheet
When it comes to organizing and managing your assignments effectively, creating a spreadsheet can be a game-changer. Setting up the spreadsheet with the right structure and categories is crucial for ensuring clarity and efficiency in tracking your assignments.
Naming The Spreadsheet
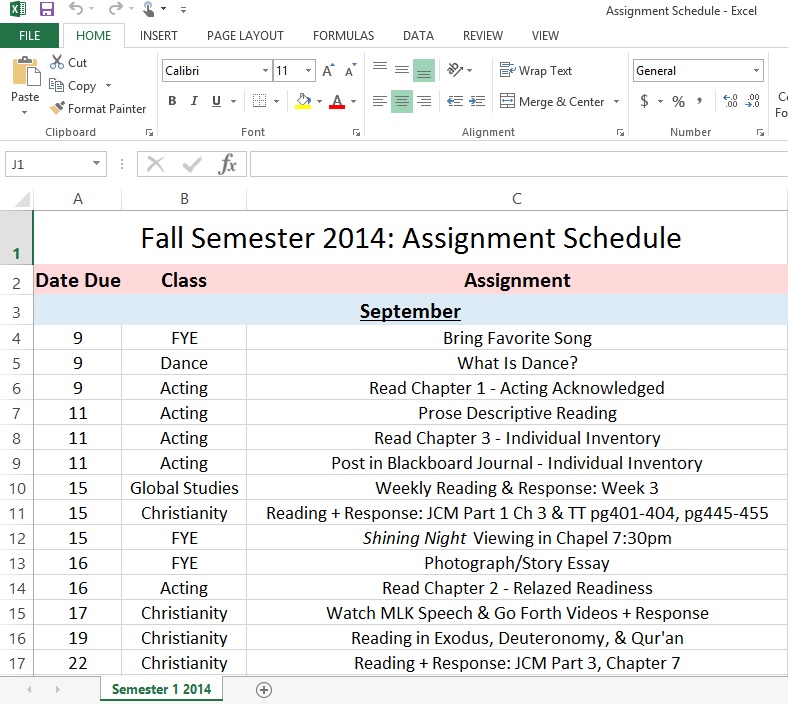
First, name your spreadsheet in a clear and descriptive manner. Use a title that reflects the purpose of the spreadsheet, such as “Assignment Tracker” or “Course Project Planner.” This sets the tone for the entire document and makes it easy to identify.
Creating The Columns
Next, start by creating the necessary columns for your assignment spreadsheet. Consider including columns for “Assignment Name,” “Due Date,” “Priority,” “Status,” and “Notes.” This will provide a comprehensive overview of your assignments and their key details.
Credit: danidearest.com
Formatting The Spreadsheet
When organizing your assignment details, proper formatting in your spreadsheet is essential for clarity. This section will guide you through the key steps to effectively format your spreadsheet.
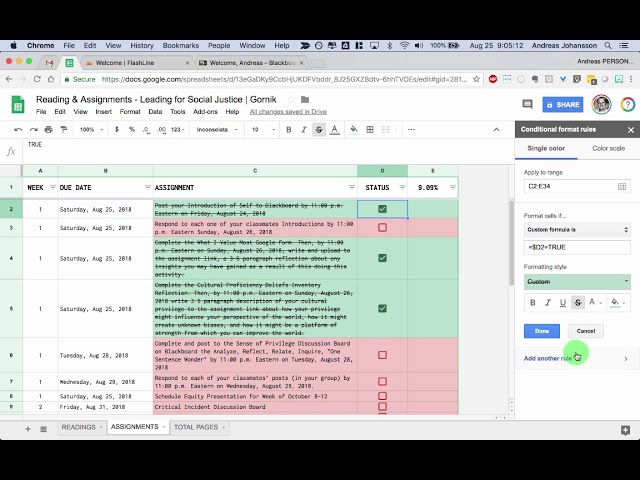
Applying Cell Formatting
To make your assignment spreadsheet visually appealing and easy to read, apply various cell formatting options. Utilize bold, italics, and different font sizes to highlight important information.
- Use bold for headers and key points
- Italicize notes or additional details
- Adjust font sizes to differentiate sections
Formatting The Text
Ensure that the text in your assignment spreadsheet is neat and consistent for clear comprehension. Standardize the font style, color, and alignment throughout the document.
- Choose a readable font type and size
- Keep all text aligned uniformly
- Use a consistent color scheme for text
Adding Borders
Borders help delineate sections and improve the overall organization of your assignment spreadsheet. Use borders to separate different categories, rows, or columns.
| Use | Borders |
| To | Section |
| Visually | Organize |
| Your | Data |
Organizing The Data
Organizing the Data:
Effective organization of your assignment spreadsheet is essential for efficient management and analysis.
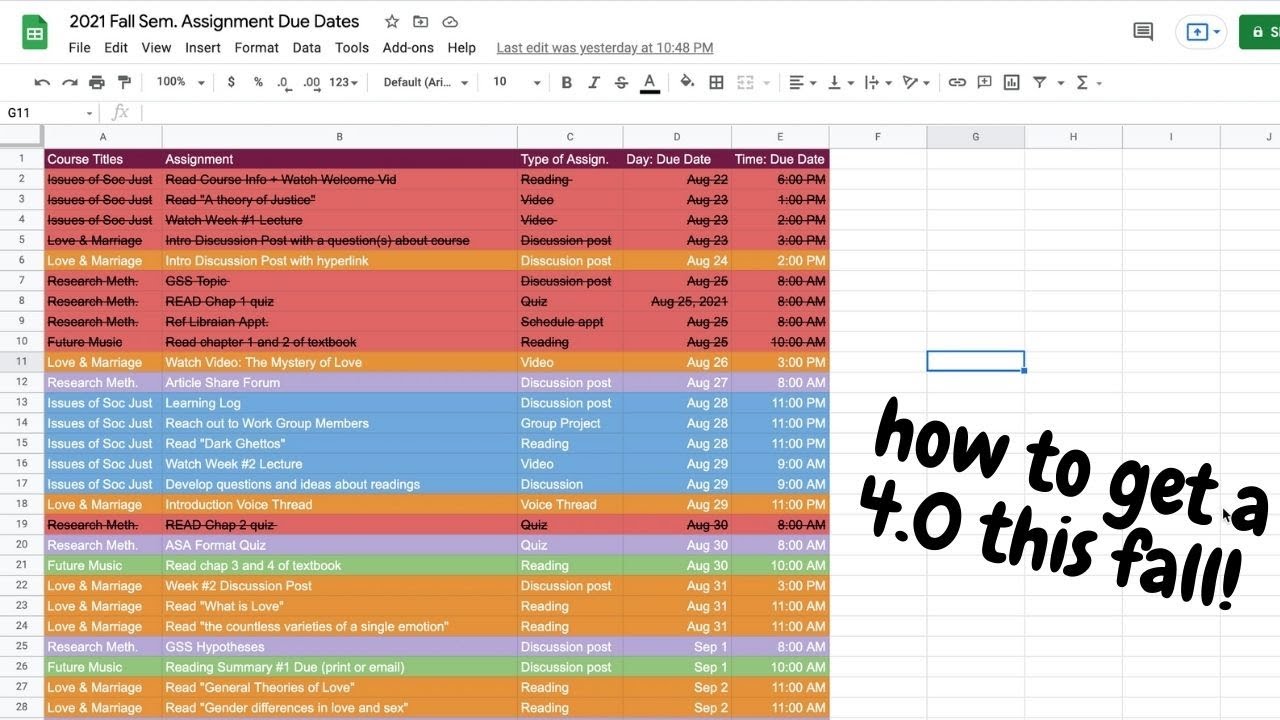
Sorting The Data
Sorting your data allows you to arrange information in a specific order for better clarity and reference.
Filtering The Data
Filtering enables you to focus on specific aspects by excluding irrelevant data points.
Grouping The Data
Grouping data helps in categorizing information based on common characteristics or criteria.
Credit: m.youtube.com
Adding Formulas And Functions
Adding Formulas and Functions is an essential part of creating an effective assignment spreadsheet. By incorporating calculated totals, conditional functions, and lookup functions, you can streamline your data processing and gain valuable insights.
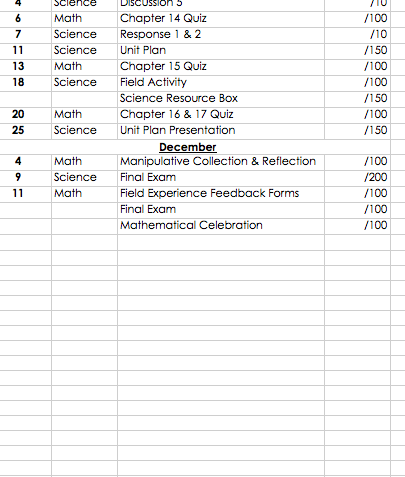
Calculating Totals
When creating an assignment spreadsheet, it’s crucial to calculate totals accurately. Utilize the SUM function to sum up a range of cells, providing a quick and efficient way to find totals. Additionally, bold highlighting the total value can help draw attention to this important figure.
Using Conditional Functions
Conditional functions are powerful tools for automating tasks in your assignment spreadsheet. Implement IF statements to evaluate certain conditions and return specific values based on the criteria met. This allows for dynamic and customized data processing based on different scenarios.
Adding Lookup Functions
Adding lookup functions such as VLOOKUP or HLOOKUP can enhance the functionality of your assignment spreadsheet. These functions enable you to search for specific data within a table and retrieve corresponding information, saving time and reducing errors in manual data retrieval.
Enhancing The Spreadsheet
Now that you have created your assignment spreadsheet and organized your data efficiently, it’s time to enhance it further by adding visual aids and advanced functionalities. This will not only make your spreadsheet more visually appealing but also provide you with valuable insights and make your data analysis process much easier.
Inserting Charts And Graphs
Charts and graphs are fantastic tools to visually represent your data. They allow you to quickly identify patterns, trends, and relationships within your assignment spreadsheet, making it easier to communicate your findings effectively. To insert a chart or graph, follow these simple steps:
- Select the data range you want to include in your chart or graph.
- Click on the “Insert” tab in the menu bar.
- Choose the type of chart or graph that best fits your data and purpose. Common options include bar charts, line graphs, pie charts, and scatter plots.
- Customize your chart or graph by formatting the axis labels, adding a title, and adjusting the color scheme.
- Once you’re satisfied with the changes, click “Insert” to add the chart or graph to your assignment spreadsheet.
Creating Pivot Tables
A pivot table is a powerful feature that allows you to summarize and analyze large amounts of data quickly. It enables you to cross-reference and consolidate information based on different variables, helping you gain deeper insights. Here’s how you can create a pivot table:
- Select the data range you want to analyze.
- Click on the “Insert” tab and select “PivotTable” from the menu.
- In the “Create PivotTable” dialog box, choose the location where you want to place the pivot table.
- Drag and drop the column headers to the rows and columns areas to define the pivot table structure.
- Add any relevant filters to further refine your analysis.
- Lastly, choose the summary function that suits your needs, such as sum, count, average, or maximum.
Adding Data Validation
Data validation is a crucial feature that helps ensure the accuracy and integrity of your assignment spreadsheet. It allows you to set specific rules and constraints on the input data, helping reduce errors and inconsistencies. Follow these steps to add data validation:
- Select the cell or range of cells where you want to apply data validation.
- Click on the “Data” tab in the menu bar.
- Select “Data Validation” from the data tools section.
- In the data validation dialog box, specify the criteria for the data, such as whole numbers, dates, or a specific list or range of values.
- Customize the error alert message to guide users in case they enter invalid data.
- Click “OK” to apply the data validation settings to your assignment spreadsheet.
Credit: organizedcharm.wordpress.com
Frequently Asked Questions Of How To Make An Assignment Spreadsheet
How Do I Create An Assignment Sheet?
To create an assignment sheet, follow these steps: 1. Start with a clear title and provide details about the assignment’s purpose. 2. Break down the task into smaller sections with specific instructions. 3. Include a due date and any relevant resources for reference.
4. Consider adding a grading rubric to provide guidance and expectations. 5. Format the assignment sheet clearly and share it with the students.
How Do I Make A Spreadsheet For All My Assignments?
To create a spreadsheet for assignments, use software like Excel or Google Sheets. Name the columns for tasks, due dates, and priorities. Enter details for each assignment and stay organized. Be sure to regularly update the spreadsheet as you complete tasks.
How Do You Create An Assignment In Excel?
To create an assignment in Excel, open a new spreadsheet and input questions or tasks. Format cells as needed, add instructions, and save the file.
How Do I Use Excel As An Assignment Tracker?
To use Excel as an assignment tracker, create a spreadsheet with columns for task names, due dates, status, and priority. Enter assignment details and update progress regularly for efficient tracking and organization. Use filters and color-coding for easy visualization and management.
Conclusion
In a nutshell, creating an assignment spreadsheet can significantly improve your productivity and organization. By following the simple steps outlined in this blog post, you can streamline your workflow and minimize stress. With the right tools and processes in place, you’ll be well-equipped to tackle your assignments efficiently and effectively.