Google Sheet Table allows users to organize data, calculate values, and create visual representations in a spreadsheet format. It’s a versatile tool for data management and analysis.
Google Sheets, a part of the Google Workspace suite, offers a powerful platform for creating, organizing, and analyzing data in a tabular format. Whether you’re tracking sales figures, managing inventory, or collaborating on a project with team members, Google Sheet Table provides a user-friendly interface with extensive functionalities.
With the ability to automatically update calculations, generate charts, and share information seamlessly, Google Sheets enables businesses and individuals to streamline their data processes and make informed decisions. We will explore the benefits and features of Google Sheet Table for effective data management and analysis.
Creating A Table In Google Sheets
Creating a Table in Google Sheets is a simple yet powerful way to organize and present data in a visually appealing manner. Whether it’s for tracking expenses, managing project timelines, or analyzing sales figures, Google Sheets offers a user-friendly platform for creating and manipulating tables.
Inserting A Table
When creating a table in Google Sheets, the first step is to insert a table into your spreadsheet. To do this, follow these simple steps:
- Select the range of cells that you want to include in your table.
- Click on the “Insert” menu at the top of the screen.
- Hover over “Table” and select “Insert table” from the dropdown menu.
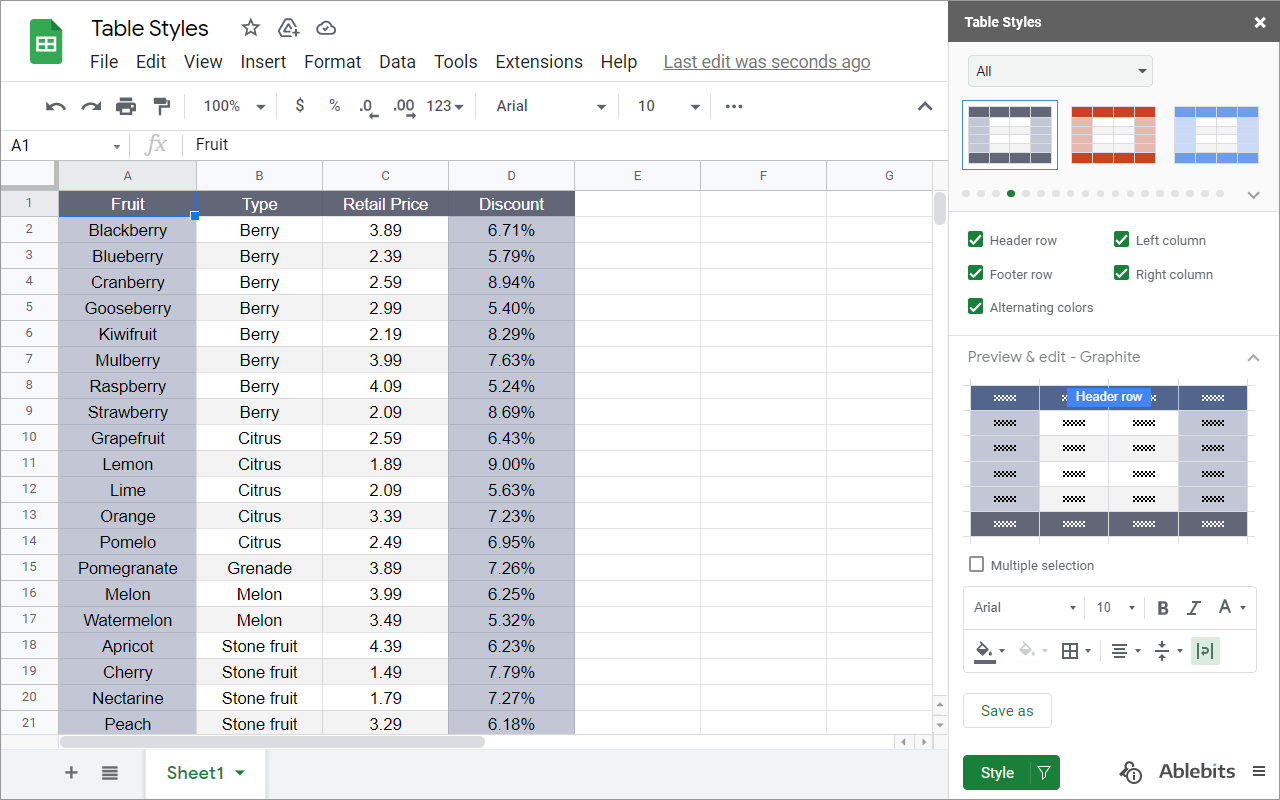
Formatting The Table
Once you have inserted a table, you can begin formatting it to better suit your needs. Here are a few key formatting options to consider:
- Color and Style: Customize the appearance of your table by changing the font, background color, and borders.
- Alignment: Adjust the alignment of your data within the cells to improve readability and visual appeal.
- Sorting and Filtering: Utilize the sorting and filtering options to organize and analyze your data effectively.
By creating and formatting tables in Google Sheets, you can efficiently manage and present your data in a way that is both visually engaging and easy to analyze.
Credit: workspace.google.com
Working With Data In Google Sheet Tables
Google Sheets Tables simplify data management, making it easy to organize and analyze information. The user-friendly interface allows for seamless data input and editing. With various formatting and customization options, Google Sheets Tables offer a versatile solution for handling data effectively.
Google Sheet Tables offer a convenient way to organize and manipulate data. Let’s explore how you can efficiently work with data in Google Sheet Tables.Adding And Editing Data
Adding and editing data in Google Sheet Tables is straightforward. Simply click on a cell and start typing to add new data. To edit existing data, just click on the cell and make your changes.Sorting And Filtering Data
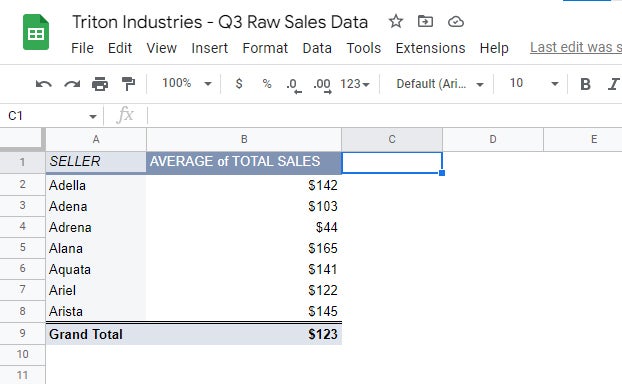
Sorting and filtering data in Google Sheet Tables make it easy to organize and analyze information. Click on the column header to sort data in ascending or descending order. Use the filter icon to apply specific filters to your data set.Using Formulas And Functions
Formulas and functions in Google Sheet Tables help automate calculations and streamline data analysis. Use functions like SUM, AVERAGE, and IF to perform complex operations on your data. When working with data in Google Sheet Tables, always remember to keep your information organized and accurate. By leveraging the various features available, you can effectively manage and analyze your data with ease.Collaborating On Google Sheet Tables
Collaborating on Google Sheet Tables allows users to work together seamlessly on data-driven projects.
From sharing and permissions to version history and revision tracking, Google Sheets facilitates efficient teamwork.
Sharing And Permissions
Easily manage who can view and edit tables by setting specific sharing permissions.
You can grant access to individuals or groups, ensuring data security and collaboration control.
Adding Comments And Notes
Enhance communication by leaving comments and notes directly on the tables.
Collaborators can provide feedback, ask questions, and share insights, fostering productive discussions.
Version History And Revision Tracking
Track changes and revert to previous versions with the version history feature.
Stay organized by monitoring edits, additions, and deletions, maintaining data accuracy.
Credit: www.computerworld.com
Credit: www.benlcollins.com
Frequently Asked Questions On Google Sheet Table
How Do I Make A Table In Google Sheets?
To make a table in Google Sheets, follow these steps: 1. Open Google Sheets and go to your desired worksheet. 2. Click on “Insert” in the menu bar and select “Table. ” 3. Choose the number of rows and columns you want for your table.
4. Adjust the size and formatting options if needed. 5. Click “Insert” to create the table on your worksheet.
Can You Format A Google Sheet As A Table?
Yes, you can format a Google sheet as a table.
Can Google Sheets Make A Table Like Excel?
Yes, Google Sheets can create tables similar to Excel. You can easily organize and format data in rows and columns.
How Do I Create A Dynamic Table In Google Sheets?
To create a dynamic table in Google Sheets, use the “Data” menu and select “Data Range. ” Input your data and choose “Insert” > “Table. ” Customize as needed.
Conclusion
Google Sheet Table makes data organization simple and efficient. With its user-friendly interface and versatile features, it’s a powerful tool for businesses and individuals alike. By harnessing the power of Google Sheets, you can streamline your data management processes and enhance productivity.
Embrace the convenience and flexibility that Google Sheets offers, and take control of your data with ease.